
This article explains how to view your account's bandwidth consumption in cPanel. It is the amount of data that entered and left, adding up all domains in the service.
What is it for?
It is used to see at what time of the day, week, or year the most data is transferred, and which service generates it. The chart separates these categories:
- HTTP: site traffic.
- FTP: uploads and downloads via FTP.
- SMTP: mail sent by the mailboxes.
- POP3 and IMAP: mail downloaded from the mailboxes.
- Total (all services): the sum of those categories.
Mail delivered to the mailboxes by other servers, File Manager uploads and downloads, DNS, and cron jobs are not included. The web number in Awstats may differ: that tool reads logs using another method.
Important: the chart times are the server times. If your browser is in a different zone, the page offers to reload with the server time. If the month's consumption approaches what is included in your service, write to the sales department from the client portal or via the online chat to upgrade it.
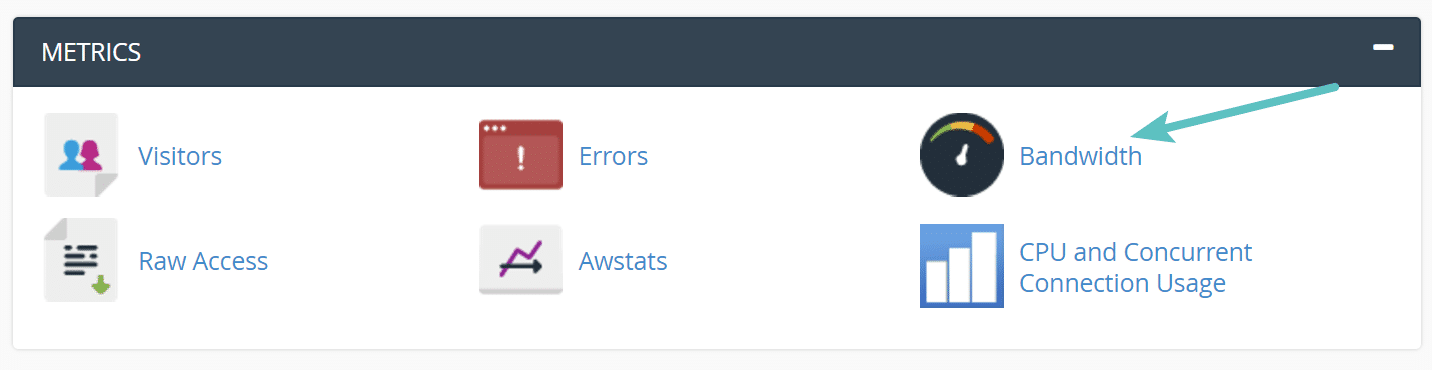
Access: log in to cPanel from the client portal → Log in to cPanel, or at https://yourdomain.com/cpanel. Open Metrics → Bandwidth. In Spanish the icon may say Ancho de banda. The same month's data appears on the main screen, under the bandwidth statistic.
Reading the charts
- Open Metrics → Bandwidth.
- At the top are the last 24 hours, the last week, and the last year.
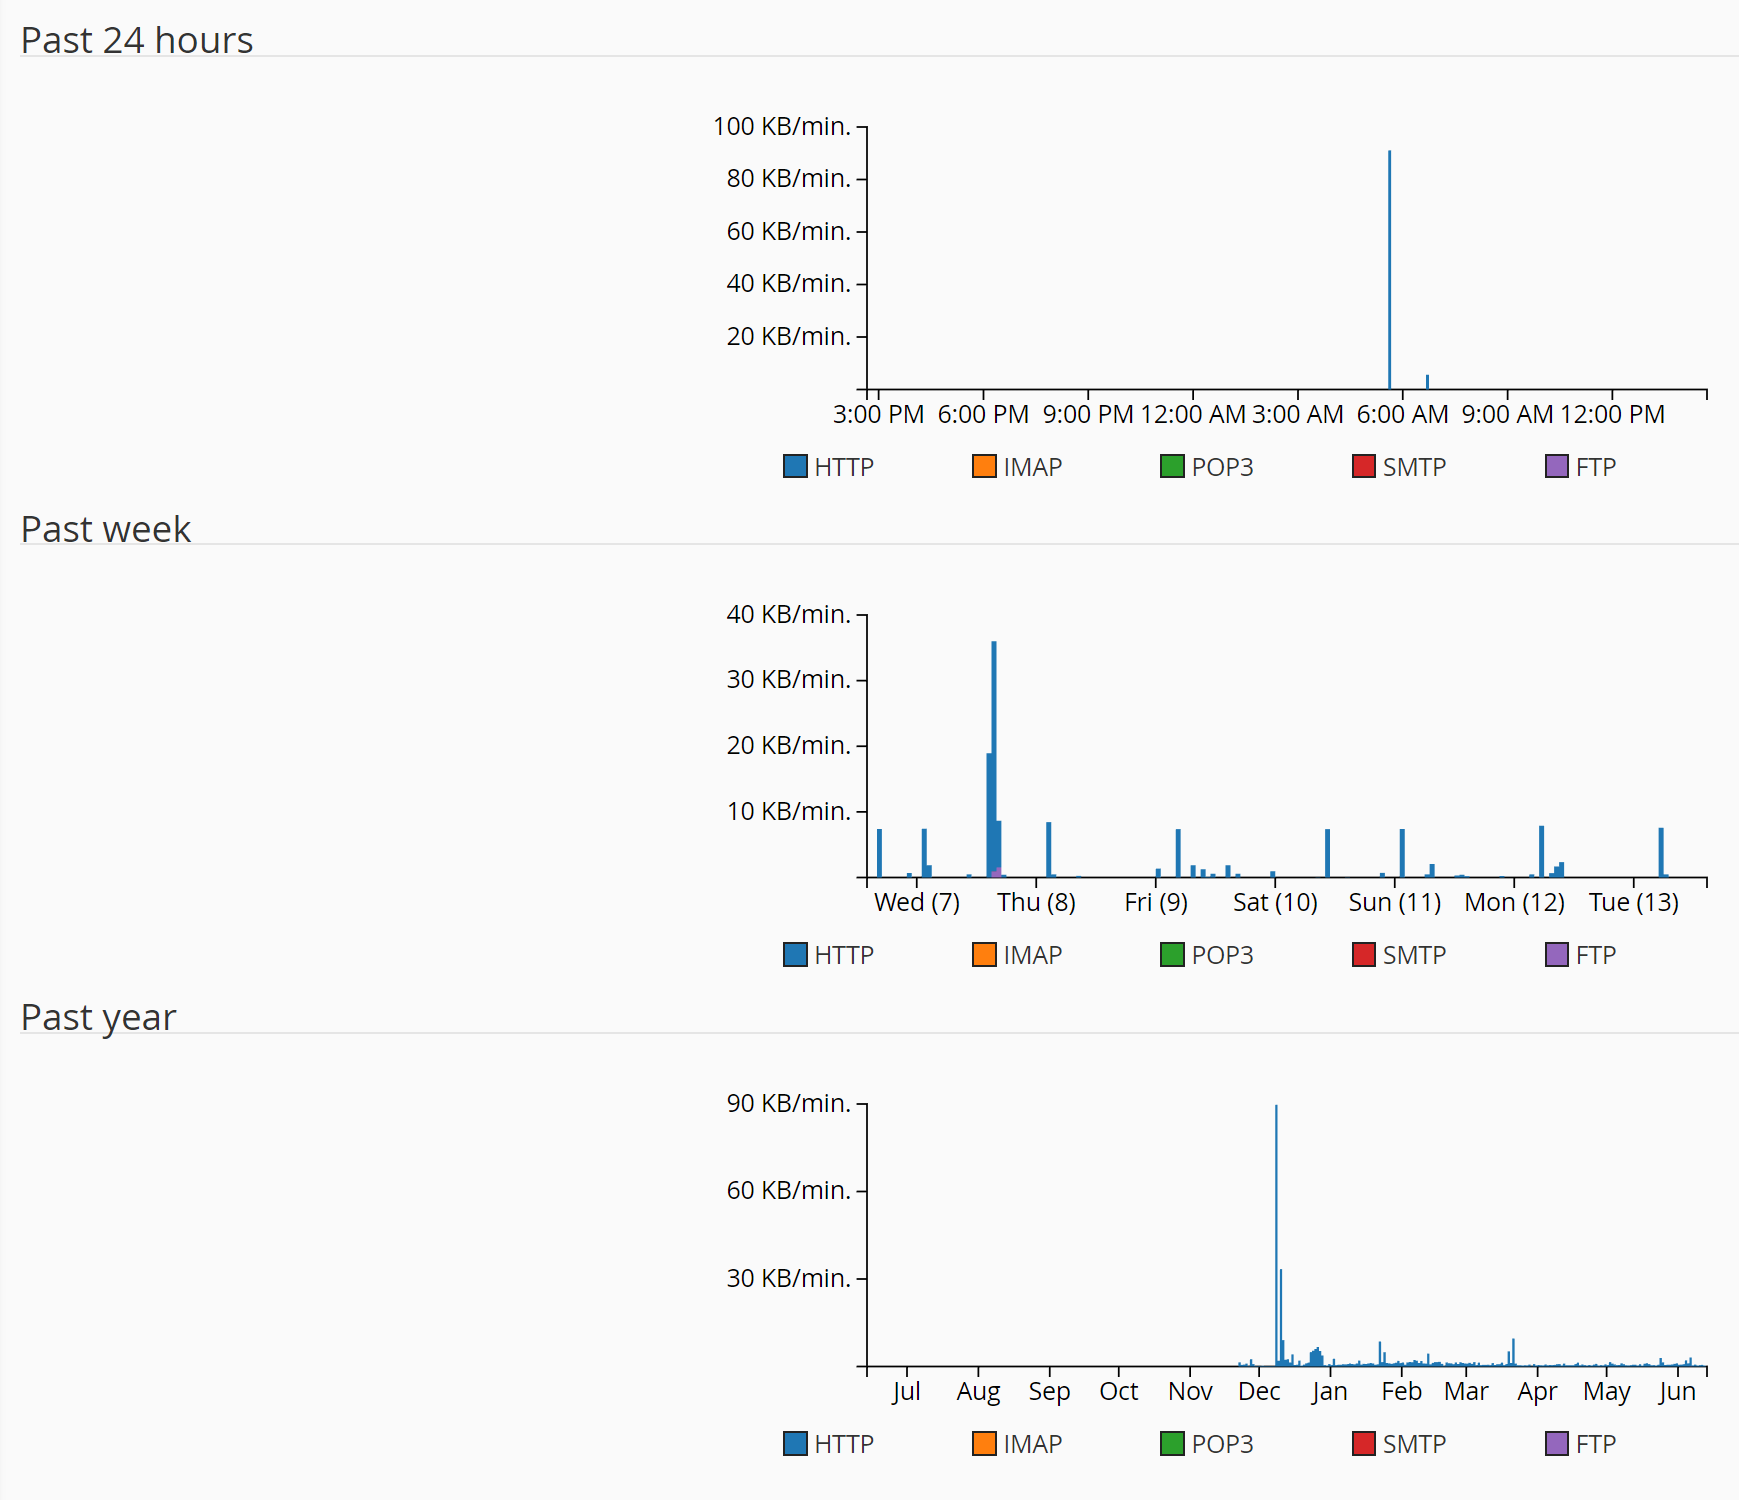
The 24 hours and the week show the transfer rate. By default, the day chart updates about every two hours. The year chart shows the total for each month, for twelve months.
- Further down, each month has a pie chart with the breakdown between services and domains.
- Click on the month's pie, or on Total (all services), to see the daily detail and that of each service.
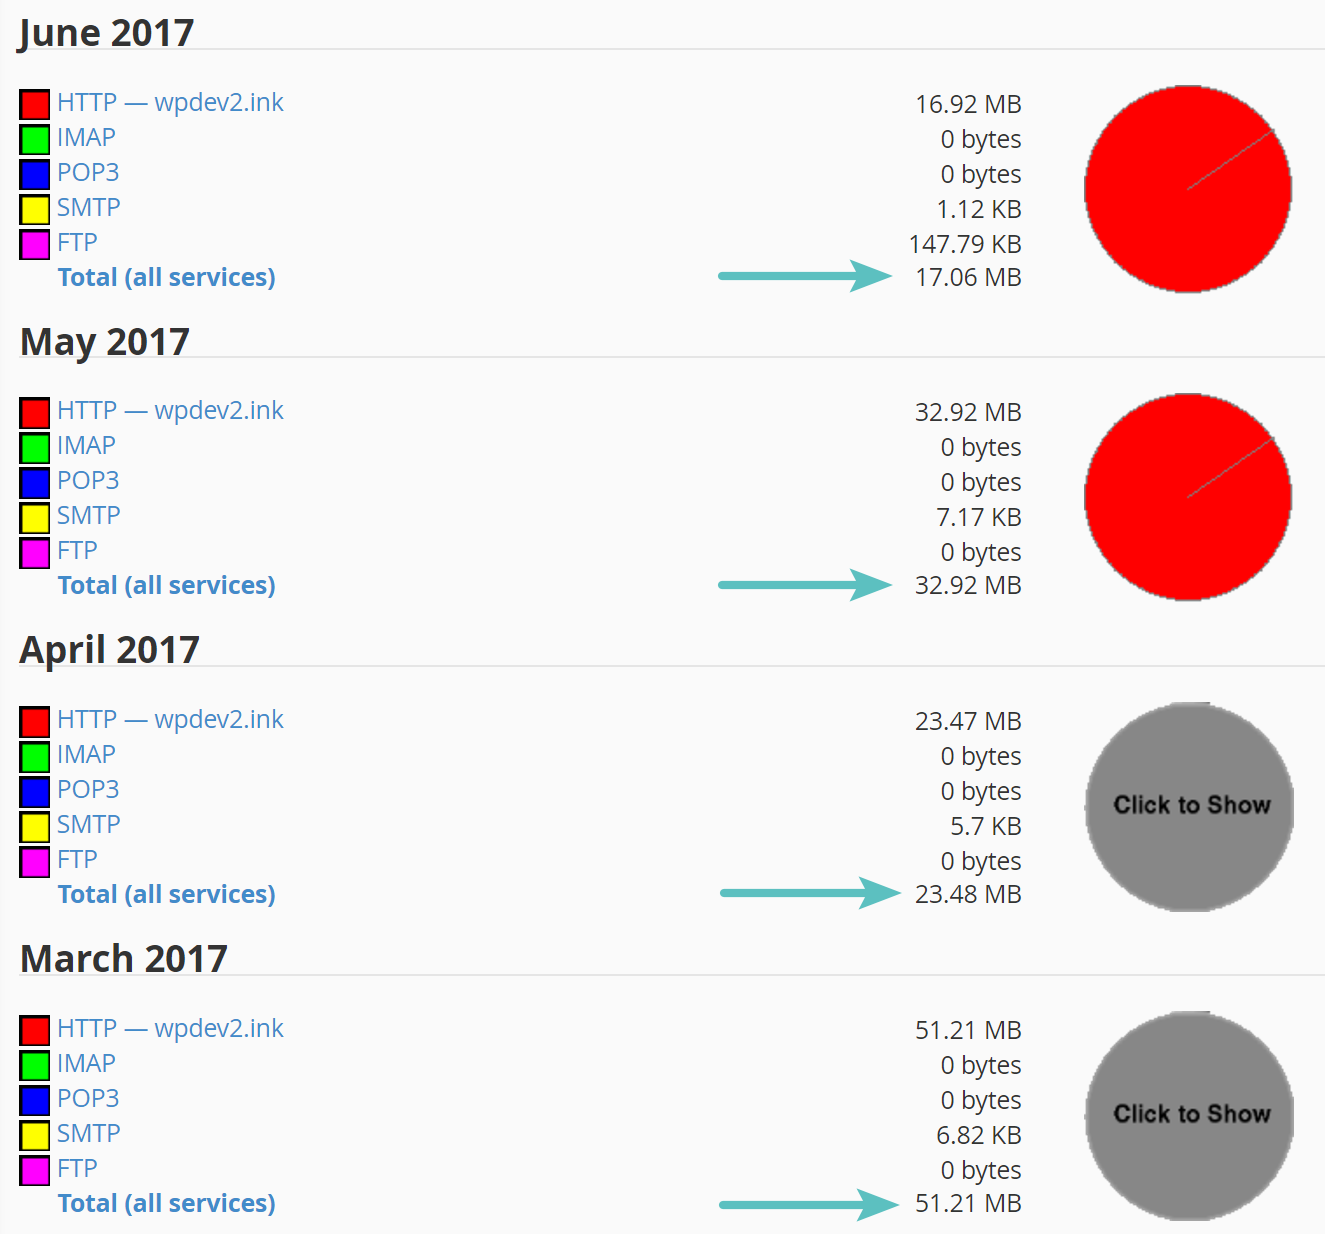
The table by day is in megabytes. It is best to check it one or two days after the day you are interested in: until then the system may continue adding to that date.
Common issues
- HTTP does not match Awstats: this screen is the account transfer. Awstats builds web traffic using logs and another calculation.
- A lot of mail arrived and it hardly shows: mail left in the mailboxes by other servers is not added. SMTP is what left the account.
- I uploaded files through the File Manager and the chart didn't move: those transfers are not included in Bandwidth.
- Today looks low: the last few hours may be missing until the next update. A day's close becomes firmer after 24 or 48 hours.
- The icon is missing: it may be disabled in the service. Open a ticket from the client portal.
If the chart does not load or a month stays at zero with the site in use, open a ticket from the client portal or inquire via the site's online chat.